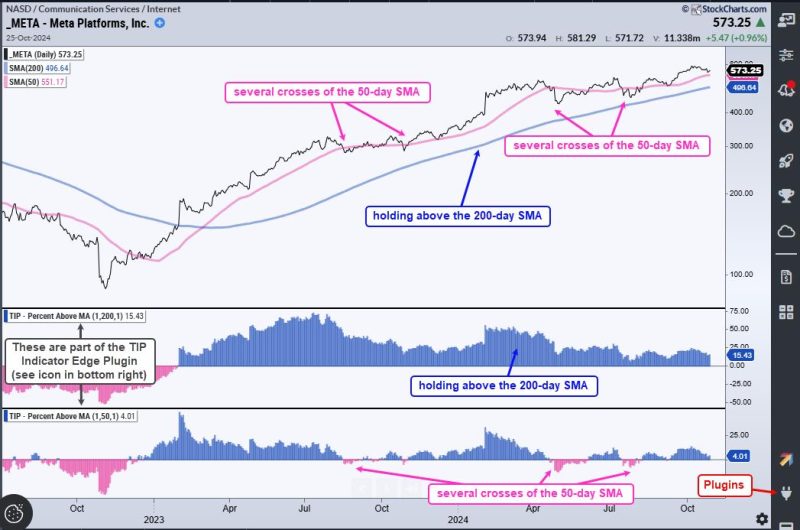
Two Indicators to Improve Your Edge
Indicator 1: Moving Averages
Moving averages are a powerful technical analysis tool that can help traders identify trends and potential entry and exit points. By looking at the average price of an asset over a specific period of time, moving averages help smooth out price fluctuations and reveal underlying trends. There are two main types of moving averages that traders commonly use: the simple moving average (SMA) and the exponential moving average (EMA).
The SMA gives equal weight to all prices in the time period being considered, while the EMA gives greater weight to more recent prices. Short-term traders often prefer EMAs because they respond more quickly to price changes, while long-term traders may opt for SMAs for a more stable trend representation.
Traders typically look for crossovers between different moving averages as indicators of potential trend reversals or continuations. A bullish crossover, where a shorter-term moving average crosses above a longer-term moving average, may signal an uptrend, while a bearish crossover, where a shorter-term moving average crosses below a longer-term moving average, may indicate a downtrend.
Indicator 2: Relative Strength Index (RSI)
The Relative Strength Index (RSI) is another popular technical indicator used by traders to analyze the strength and momentum of a price trend. The RSI is a bounded oscillator that ranges from 0 to 100 and measures the speed and change of price movements. When the RSI value is above 70, it is considered overbought, indicating that the asset may be due for a price correction. Conversely, an RSI value below 30 suggests that the asset may be oversold and due for a potential bounce back.
Traders often use the RSI in conjunction with other indicators to confirm signals and make informed trading decisions. For example, if a stock price is making new highs but the RSI is declining, it may indicate a potential divergence and signal a weakening trend. On the other hand, if a stock price is hitting new lows but the RSI is rising, it could suggest a bullish reversal may be imminent.
In conclusion, moving averages and the Relative Strength Index are valuable tools that traders can use to improve their edge in the market. By understanding how to interpret these indicators and incorporate them into their trading strategies, traders can gain valuable insights into market trends, potential entry and exit points, and overall market sentiment. It is essential for traders to practice using these indicators in different market conditions and develop a thorough understanding of how they can be applied effectively to enhance their trading performance.
