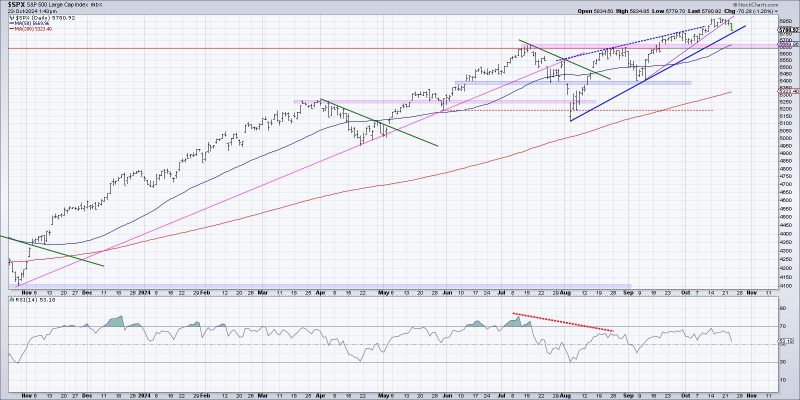
Visualizing the start of a potential distribution phase in the stock market can be challenging yet crucial for investors and traders alike. Recognizing key indicators and understanding patterns can provide valuable insights into market trends. Here are three effective ways to visualize and analyze the potential beginning of a distribution phase:
1. Volume Analysis:
Volume plays a significant role in identifying the start of a distribution phase. An increase in trading volume can signal a shift in market sentiment from accumulation to distribution. By analyzing volume patterns alongside price movements, investors can detect discrepancies that may indicate institutions or large traders are distributing their holdings.
Volume analysis tools such as the on-balance volume (OBV) indicator and volume bars can help to visualize the relationship between buying and selling pressure. Sudden spikes in selling volume or a series of high-volume down days can be early warning signs of distribution. Traders can use these signals to adjust their strategies and consider reducing their exposure to potential downside risks.
2. Price and Trend Analysis:
Monitoring price action and trend dynamics is essential for identifying the onset of a distribution phase. As the market transitions from an accumulation phase to distribution, prices may exhibit specific patterns such as lower highs and lower lows. Additionally, the formation of distribution patterns such as head and shoulders, double tops, or descending triangles can provide visual cues of a potential trend reversal.
Technical indicators like moving averages, trendlines, and Fibonacci retracement levels can aid in visualizing price trends and potential reversal points. By combining price analysis with volume data, investors can gain a comprehensive view of market conditions and make informed decisions regarding their investment positions.
3. Market Breadth and Sentiment:
Market breadth indicators offer valuable insights into the overall health of the stock market and can help identify shifts in investor sentiment. Widening divergences between advancing and declining issues, as well as deteriorating market internals, may indicate a weakening market structure conducive to distribution.
Analyzing sentiment indicators such as the put/call ratio, investor surveys, and market sentiment indexes can provide additional context to market breadth analysis. Extreme readings in sentiment indicators, especially bearish sentiment prevailing in a rising market, can suggest that investors are becoming increasingly cautious and may be preparing to distribute their holdings.
In conclusion, visualizing the start of a potential distribution phase in the stock market requires a comprehensive approach that combines volume analysis, price and trend analysis, and market breadth indicators. By leveraging these visualization techniques, investors and traders can enhance their market analysis skills, anticipate potential trend reversals, and adjust their investment strategies accordingly. Remember, staying informed and continuously monitoring market conditions are key to navigating the complexities of market phases effectively.
