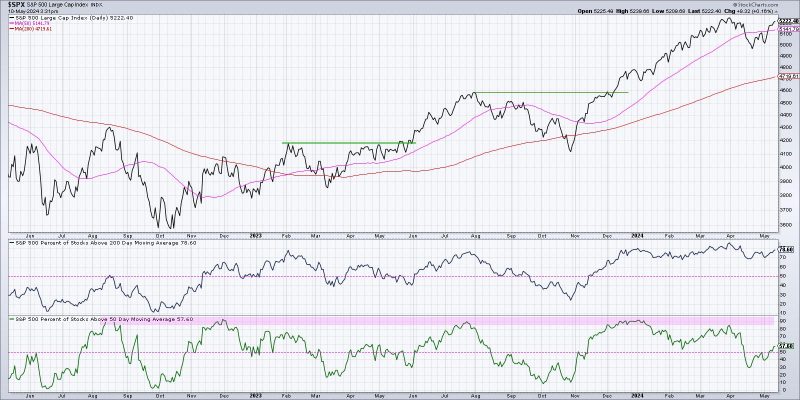
Breadth indicators play a crucial role in confirming the strength and sustainability of a market trend. In the world of financial markets, these indicators provide traders and investors with valuable insights into the overall health of the market beyond just looking at price movements. By analyzing various breadth indicators, market participants can gain a better understanding of market sentiment and the breadth of participation in a particular trend. Here are three key breadth indicators that can help confirm a bullish market trend:
1. **Advance-Decline Line (A/D Line)**: The Advance-Decline Line is a breadth indicator that measures the cumulative number of advancing stocks minus declining stocks on a given trading day. A rising A/D line indicates that a large number of stocks are participating in the upward movement, suggesting broad market strength. When the A/D line is trending higher along with the price of the index, it confirms the bullish trend. Conversely, if the A/D line is diverging from the price trend, it could signal a potential weakness in the market trend.
2. **New Highs-New Lows Index**: The New Highs-New Lows Index compares the number of stocks hitting new highs versus those hitting new lows over a specific period, usually a rolling 52-week period. In a healthy bullish trend, we expect to see a high number of stocks hitting new highs relative to those hitting new lows. When the New Highs-New Lows Index is rising, it indicates a broad participation of stocks reaching new highs, supporting the bullish case. On the other hand, a declining index could be a sign of weakening market breadth and potential bearish divergence.
3. **McClellan Oscillator**: The McClellan Oscillator is a popular market breadth indicator that measures the difference between advancing and declining stocks on the New York Stock Exchange. It provides a smoothed indicator of market breadth by calculating a 19-day and 39-day exponential moving average of the net advancing stocks. A positive McClellan Oscillator reflects a strong market breadth, suggesting a healthy uptrend. Conversely, a negative oscillator may indicate weakening market breadth and potential downside risks.
By monitoring these three breadth indicators – Advance-Decline Line, New Highs-New Lows Index, and McClellan Oscillator – traders and investors can gain valuable insights into the underlying strength of a bullish market trend. These indicators help confirm the sustainability of the trend by assessing the breadth of participation across various stocks in the market. Remember that no single indicator can provide a foolproof confirmation of a trend, so it is essential to analyze a combination of indicators to make well-informed decisions in the dynamic world of financial markets.
