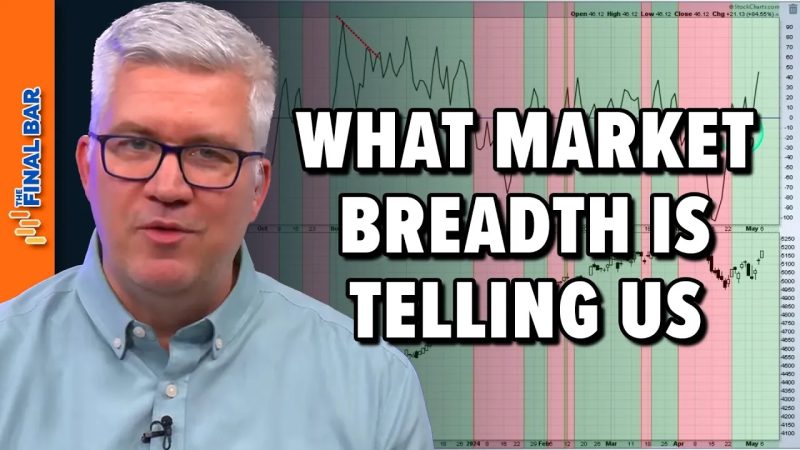
The Breadth of the Market: A Vital Indicator for Investors
Understanding the pulse of the market is crucial for investors seeking to make informed decisions and manage risks effectively. Amidst the array of indicators available, one often overlooked but incredibly important metric is market breadth. Market breadth refers to the proportion of stocks moving in a certain direction within an index, reflecting the overall participation and health of the market. While traditional metrics like price movements and volume provide valuable insights, market breadth indicators offer a deeper understanding of market sentiment and potential shifts in trend.
Market breadth indicators, such as the Advance-Decline Line and the McClellan Oscillator, provide valuable information on the internal strength or weakness of the market. The Advance-Decline Line measures the number of advancing stocks minus the number of declining stocks on a given trading day. A rising Advance-Decline Line indicates broad market participation and underlying strength, suggesting a healthy market environment. Conversely, a declining line could signal impending weakness or a potential reversal in the market.
The McClellan Oscillator, another popular breadth indicator, compares the moving averages of advancing and declining stocks over a specific period. This indicator helps investors gauge the momentum of market breadth by quantifying the difference between advancing and declining stocks. A high McClellan Oscillator reading implies a strong uptrend with broad participation, while a low reading may indicate a market where only a few stocks are driving the overall index higher, potentially leading to a fragile market environment.
Monitoring market breadth indicators can provide investors with a holistic view of the market dynamics beyond just price movements. By assessing the breadth of market participation, investors can identify divergences between the market index and the underlying breadth, which may signal potential reversals or changes in market sentiment. Moreover, market breadth indicators can help confirm the strength of a trend or provide early warnings of potential market turning points, enabling investors to adjust their investment strategies accordingly.
Incorporating market breadth analysis into investment decision-making processes can enhance risk management and increase the probability of successful trades. By combining traditional technical analysis with market breadth indicators, investors can gain deeper insights into market conditions and mitigate potential risks associated with abrupt market movements. Understanding the underlying breadth of the market empowers investors to make well-informed decisions based on a comprehensive assessment of market sentiment and participation.
In conclusion, market breadth indicators offer a valuable perspective on market dynamics and sentiment that is often overlooked by many investors. By monitoring indicators such as the Advance-Decline Line and the McClellan Oscillator, investors can gain a deeper understanding of market participation and potential shifts in trend, enabling them to navigate volatile markets with greater confidence and precision. Embracing market breadth analysis as a complementary tool to traditional technical analysis can provide investors with a more comprehensive view of the market landscape, enhancing their decision-making processes and ultimately improving their overall investment performance.
