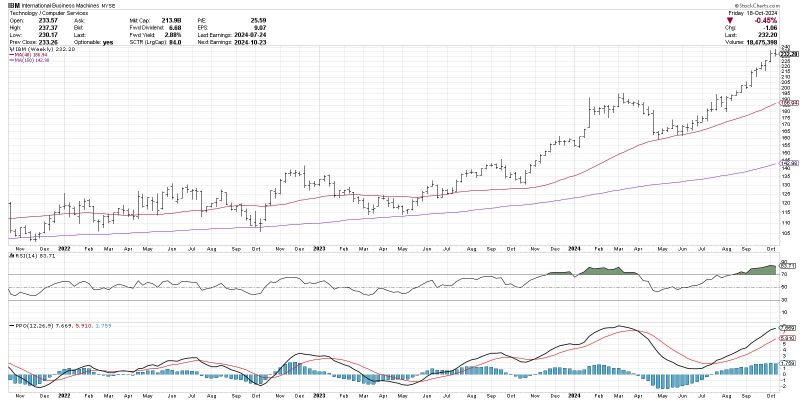
The Moving Average Convergence Divergence (MACD) is a popular indicator used by traders to identify potential trend changes in various financial markets. One often overlooked aspect of the MACD is the MACD Histogram, which provides valuable signals for anticipating shifts in market direction. In this article, we will explore how the MACD Histogram holds the secret to anticipating trend changes and how traders can effectively utilize this tool in their decision-making process.
Understanding the MACD Histogram
The MACD Histogram is derived from the traditional MACD indicator and represents the difference between the MACD line and the signal line. It helps traders visualize the momentum of the price action and provides insights into potential trend changes. When the MACD Histogram is positive, it indicates that the MACD line is above the signal line and that bullish momentum is prevailing in the market. Conversely, a negative MACD Histogram suggests bearish momentum.
Anticipating Trend Changes with the MACD Histogram
One of the key secrets to anticipating trend changes using the MACD Histogram is to look for divergences between the price action and the Histogram. Divergences occur when the price of an asset is moving in one direction while the MACD Histogram is moving in the opposite direction. This divergence signals a potential shift in momentum and often precedes a trend reversal.
Additionally, traders can also pay attention to the zero line crossover of the MACD Histogram. When the Histogram crosses above the zero line, it indicates a shift from bearish to bullish momentum, suggesting a potential uptrend. Conversely, a crossover below the zero line signals a shift from bullish to bearish momentum, hinting at a possible downtrend.
Using the MACD Histogram in Practice
To effectively utilize the MACD Histogram in trend anticipation, traders can combine it with other technical analysis tools such as trendlines, support and resistance levels, and other indicators. By confirming the signals generated by the MACD Histogram with other tools, traders can increase the accuracy of their predictions and make more informed trading decisions.
It is important to note that no indicator is infallible, and traders should always exercise caution and use risk management strategies when trading based on the MACD Histogram or any other technical indicator. Additionally, it is recommended to combine technical analysis with fundamental analysis to gain a comprehensive view of the market and make well-rounded trading decisions.
In conclusion, the MACD Histogram holds valuable insights into anticipating trend changes in the financial markets. By understanding how to interpret divergences, zero line crossovers, and incorporating it into a comprehensive trading strategy, traders can enhance their ability to identify potential trend reversals and capitalize on profitable trading opportunities.
